Wake Up Washtenaw "White Paper"
5. Possible Development: Greenfield
Consider what follows as an illustration of the type of sustainable, transit-oriented community that might be created in a greenfield situation.
Here is a satellite image of an illustrative site. 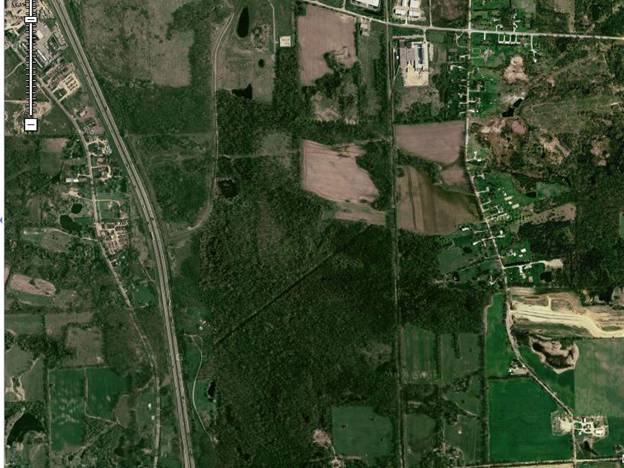
The straight line running top to bottom, just right of center, is a lightly-used rail line which could serve as the transit link between a community and other communities in the area
The next image shows one possible arrangement of the community features discussed in Section 3 “Goals” (above).
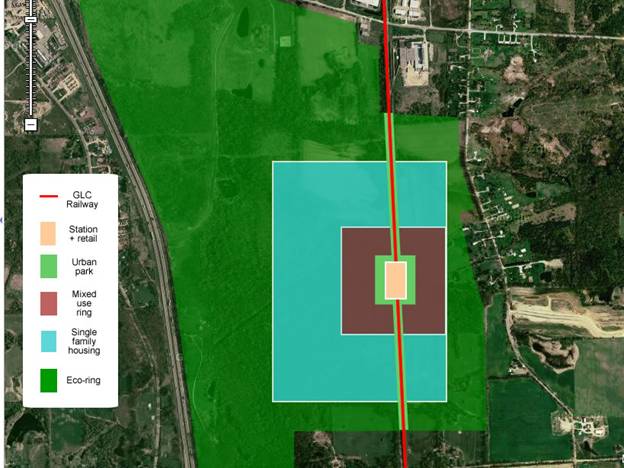
The red line is the railway. As it passes through the community area, it would be surrounded by a protective berm planted with trees and shrubs as a noise barrier. Midway between the north and south boundaries of the development area is a station with retail space (tan), surrounded by a small, urban park (green). If you were to get off a train here, you would find a four-block mixed use area with shops, office space, and apartments or condominium properties. The buildings here would be perhaps four stories high, with green roofs and 2-3 levels of parking beneath. Walking further out from the center, you would come to two or three blocks of single-family houses of varying sizes, before arriving at the eco-ring which surrounds the entire community.
The community needs to have a robust population size in order to support the investment. To estimate the population, the layout in the next image was roughed out. It should be understood not as a design suggestion but as a tool for answering the question, “How many people could live here?” An approximate number is arrived at by estimating the average number of people for each type of housing unit.

The table below shows the calculations based on this hypothetical community layout, arriving at a total of 9,772 potential inhabitants.
|
Green Community: Theoretical Residential Capacity |
||||||||||||
|
Single-family homes |
||||||||||||
|
House type |
Blk Len Ft |
Blk Wid Ft |
Blk Area SqFt |
Lots per acre |
Lot Area SqFt |
Houses per block |
Avg. Occu-pancy |
Avg. pop/ block |
Blocks |
Houses |
Residents |
|
|
1 |
Larger (triangular blocks) |
800 |
800 |
320,000 |
4 |
10,890 |
29 |
4 |
118 |
4 |
118 |
470 |
|
2 |
Moderate |
700 |
500 |
350,000 |
8 |
5,445 |
64 |
4 |
257 |
4 |
257 |
1,028 |
|
3 |
Small ("townhouse") |
900 |
700 |
630,000 |
16 |
2,723 |
231 |
3 |
694 |
2 |
463 |
1,388 |
|
4 |
Tiny |
900 |
250 |
225,000 |
24 |
1,815 |
124 |
1.3 |
161 |
4 |
496 |
645 |
|
Total |
3,532 |
|||||||||||
|
Apartments/Condos |
Len Ft |
Wid Ft |
SqFt |
|
|
Units per block |
Avg. Occu-pancy |
Avg. pop/ block |
Blocks |
Units |
Residents |
|
|
5 |
Central land area |
1500 |
1500 |
2,250,000 |
||||||||
|
6 |
Less park & station |
900 |
750 |
675,000 |
||||||||
|
7 |
Less streets & courts |
1,250,000 |
||||||||||
|
8 |
Space per floor |
325,000 |
||||||||||
|
9 |
Residential floors |
3 |
||||||||||
|
10 |
Total residential space |
975,000 |
||||||||||
|
11 |
Space per apartment |
1,250 |
||||||||||
|
12 |
|
|
|
|
780 |
2.0 |
1,560 |
4 |
3,120 |
6,240 |
||
|
Total Estimated Residential Capacity |
|
|
|
|
9,772 |
|||||||
Notes on the Calculations
Some have expressed doubt about the calculations in this table. That doesn’t surprise me, since I was amazed at the results myself, particularly of the residential capacity of the mixed-used apartment area. Here is the background of each estimate, keyed to the number of each row in the table.
- Larger houses: Average occupancy 4, because this type of house would be appropriate for families with children. Average lot size is a generous ¼ acre (10,890 square feet), though with triangular blocks, lot size could vary considerably. (Triangular blocks are specified at the corners of the development to provide more direct walking access to the town center.)
- Moderate houses: Average occupancy also 4, with lots 5,445 square feet providing fairly typical “suburban” setbacks.
- Smaller houses are suggested in a townhouse design - that is, without lateral setbacks and with front setbacks no more than 12 feet. An average of three occupants provides for a mix of young couples, families, and empty-nesters. Lot size of 2,723 square feet is more than adequate for townhouses of generous size, while allowing for open space within each block.
- ”Tiny house” is a classification that has arisen in the last few years. “Tiny” is generally considered to be under about 500 square feet. Efficient designs are available from such companies as Ross Chapin Architects[i], Tiny Home Company[ii], and Tumbleweed Tiny House Company[iii]. Because of their limited size, a significant percentage will have only one occupant; hence the estimate of an average occupancy of 1.3. Lot size of 1,815 square feet allows for separation between houses as well as gardens.
Calculating potential apartment population is a bit more complicated due to the irregular shape of the apartment area and the need for open courts within the buildings themselves. Given the shape of the area allocated for the center of the development – transit station, park, streets, and mixed use areas – we start with the total area of the center and subtract the non-residential areas within it:
- The town center as envisioned for this estimate is about 1500 by 1500 linear feet, giving a total area of 2,250,000 square feet.
- The station and its surrounding park are 900 by 750, that is, 675,000 square feet to be subtracted from the central area.
- 1,250,000 square feet is a rough estimate of space needed for open courts within buildings and streets around them.
- With four blocks of apartments, we get 325,000 square feet of residential space on each floor.
- Four stories in the central area provides a reasonable population for the development, without overshadowing the smaller surrounding houses. Since the ground level is intended for office and retail use, only the upper three stories are residential. (Two or three levels below would provide parking space. Soil excavated for the basements of these buildings would be available for berm around the railway line and other uses. On the roof, a glass-enclosed “green” level might provide space for growing vegetables, trapping solar energy, and renewing air quality.)
- Total residential space on the three floors comes out to 975,000 square feet.
- The floor space estimated “per apartment,” 1,250 square feet, may seem overly generous, but actually includes corridor and utility space, such as storage and laundry rooms.
- With 780 units per block, we estimate 2 people average per apartment, allowing for single occupants, couples, and some children. Four blocks of 1,560 residents results in 6,240 apartment/condo residents in 3,120 units.
The total population including apartment/condo and home residents would be 9,772. Of these, approximately 64% would live in apartments or condos, 7% in “tiny houses”, 14% in townhouses, 11% in moderate size houses with individual yards, and 5% in larger houses.